Turnover Statistics
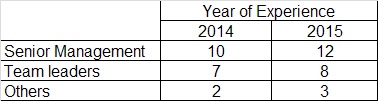
If you want to show the movement of number of employees, you may tend to show the actual figures like this:
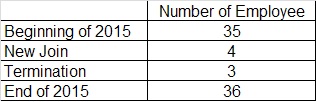
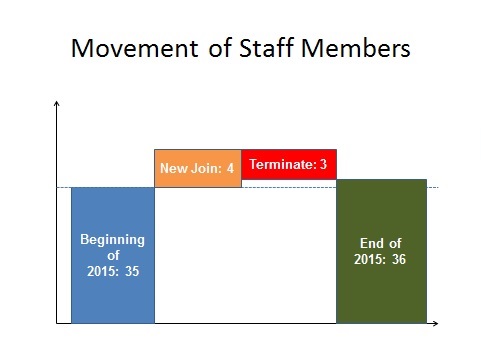
However, to give a clearer picture to management, did you think about how to present in chart similar to below for easier understanding?
Movement in Number of Staff Member in Year 2015:
Meanwhile, while it is always your tasks to address the problem of turnover, please do not forget to present the correct picture to your boss. For example:
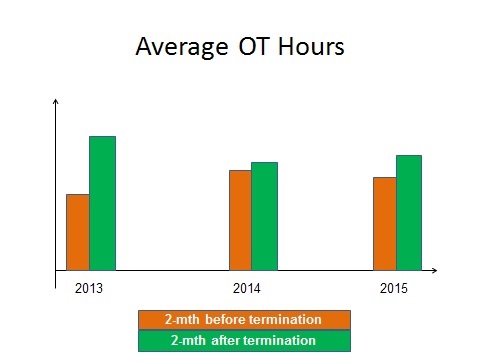
1) Are Other Staff Members Being Affected?
You can take a look at the OT hours of other staff members, before or after the resignation of their colleagues. This will give you and management a sense whether the resignation of particular staff member results in signaficant increase in workload of other colleagues.
Or, resignation of the particular staff member has no impact on others' workload while production and revenue of the company remain unchanged?
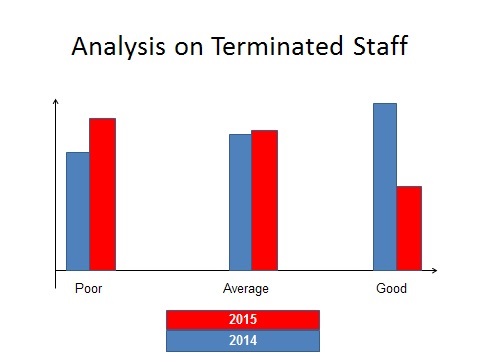
2) Who Stay and Who Leave?
It will be totally different if those who left are "poor" in appraisal, or "good" in appraisal.
Not a bad idea to eliminate under-performer in a natural manner.
3) OK People Are Leaving. But The Result Is?
Maybe turnover is part of life. So why don't we focus on how experienced our remaining staff members are, instead of focusing on someone who have left?
See also:
- How to address turnover problem?
- How to calculate turnover rate?
